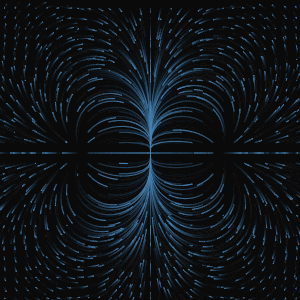
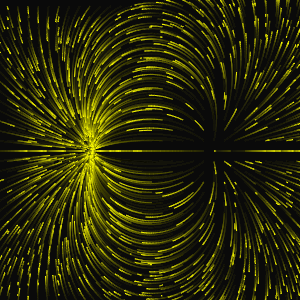
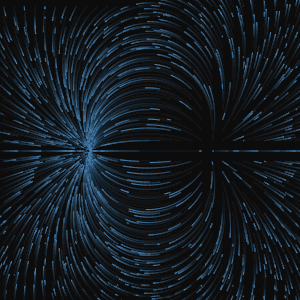
Template: Graphics/vector-chart-from-vector-potential
Discription: Vector chart of the magnetic field distribution created using the vector potential for a pair of long parallel current wires.
Link: Click this link to see the live chart or shape.
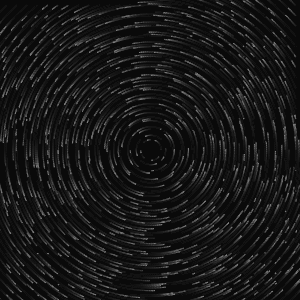
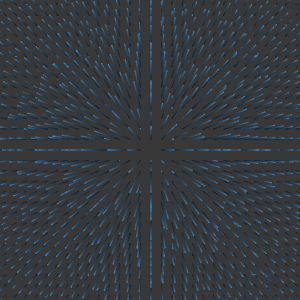
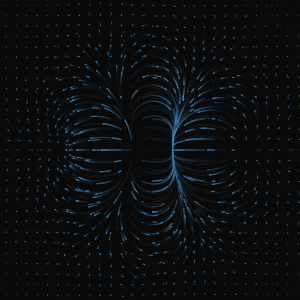
Template: Graphics/vector-chart-from-vector-potential
Discription: Vector chart of the magnetic field distribution created using the vector potential for a current wire.
Link: Click this link to see the live chart or shape.

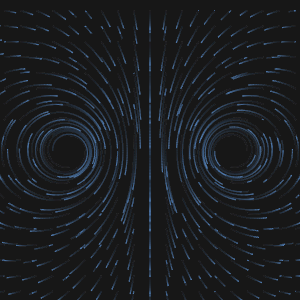
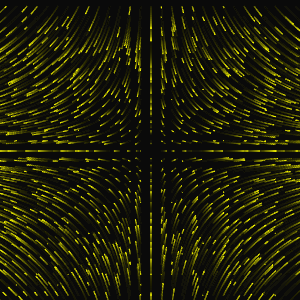
Template: Graphics/vector-chart-from-field
Discription: Vector chart created using the field components for a wire current (magnetic field distribution).
Link: Click this link to see the live chart or shape.
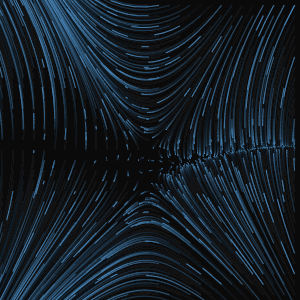
Template: Graphics/vector-chart-from-field
Discription: Vector chart created using the field components for a cosine-sine field.
Link: Click this link to see the live chart or shape.
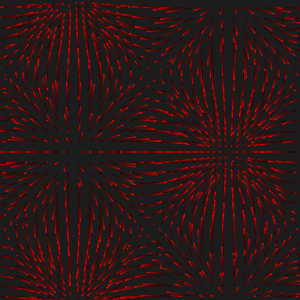
Template: Graphics/vector-chart-from-field
Discription: Vector chart created using the field components for an electric dipole field.
Link: Click this link to see the live chart or shape.
Template: Graphics/vector-chart-from-field
Discription: Vector chart created using the field components for a point charge.
Link: Click this link to see the live chart or shape.
Template: Graphics/vector-chart-from-field
Discription: Vector chart created using the field components for a wind model.
Link: Click this link to see the live chart or shape.

Template: Graphics/vector-chart-from-field
Discription: Vector chart created using the field components for an X-Y field.
Link: Click this link to see the live chart or shape.
Template: Graphics/vector-chart-from-potential
Discription: Vector chart created using potential for a potential function of a*y*sin(x) + b*x*y^2.
Link: Click this link to see the live chart or shape.
Template: Graphics/vector-chart-from-potential
Discription: Vector chart created from potential for a charge rod.
Link: Click this link to see the live chart or shape.

Template: Graphics/vector-chart-from-potential
Discription: Vector chart created using potential for an electric dipole.
Link: Click this link to see the live chart or shape.
Template: Graphics/vector-chart-from-potential
Discription: Vector chart created using the potential for an electric octupole.
Link: Click this link to see the live chart or shape.
Template: Graphics/vector-chart-from-potential
Discription: Vector chart created using potential for a point charge.
Link: Click this link to see the live chart or shape.

Template: Graphics/vector-chart-from-potential
Discription: Vector chart created using the potential for an electric quadrupole.
Link: Click this link to see the live chart or shape.