Template: Graphics/complex-domain-coloring
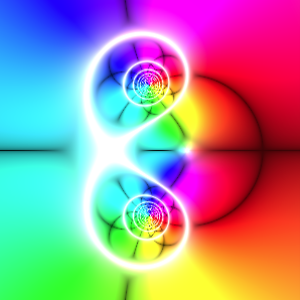
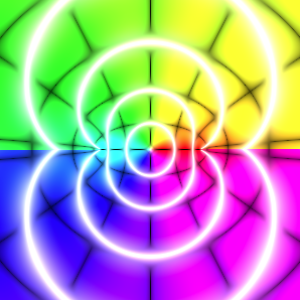
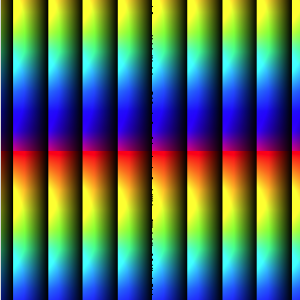
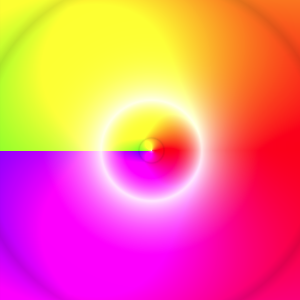
Discription: Domain coloring is a technique for visualizing complex functions. It represents the phase with a color hue value and the magnitude by brightness or saturation.
Link: Click this link to see the live chart or shape.
Template: Graphics/complex-domain-coloring
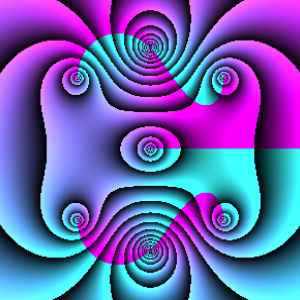
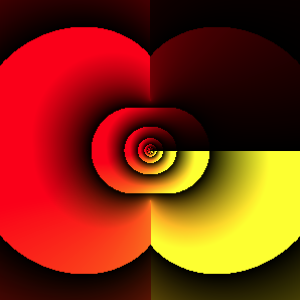
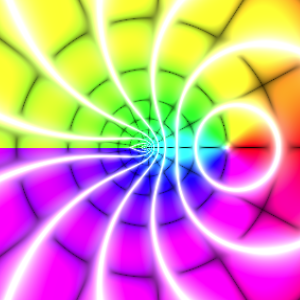
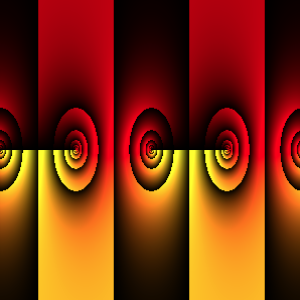
Discription: Domain coloring is a technique for visualizing complex functions. It represents the phase with a color hue value and the magnitude by brightness or saturation.
Link: Click this link to see the live chart or shape.
Template: Graphics/complex-domain-coloring
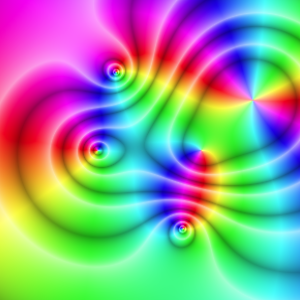
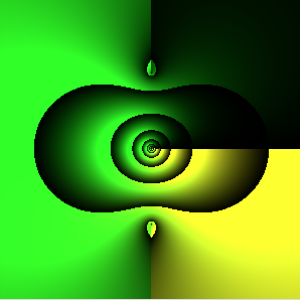
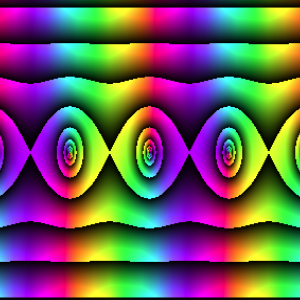
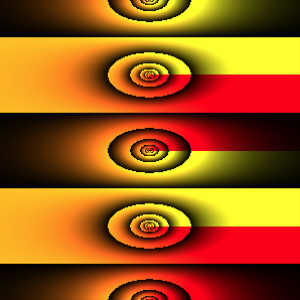
Discription: Domain coloring is a technique for visualizing complex functions. It represents the phase with a color hue value and the magnitude by brightness or saturation.
Link: Click this link to see the live chart or shape.
Template: Graphics/complex-domain-coloring
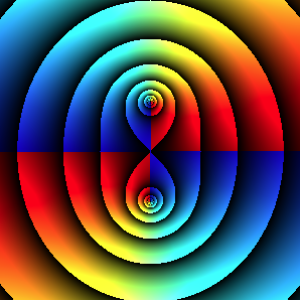
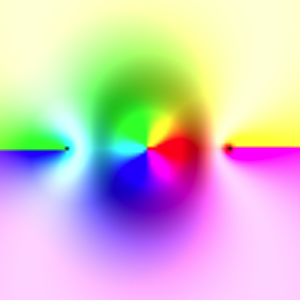
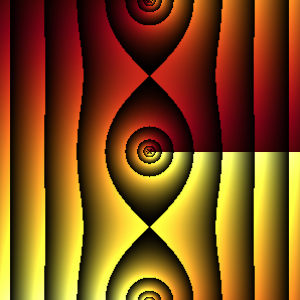
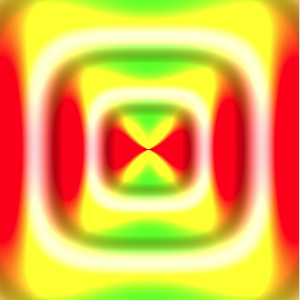
Discription: Domain coloring is a technique for visualizing complex functions. It represents the phase with a color hue value and the magnitude by brightness or saturation.
Link: Click this link to see the live chart or shape.
Template: Graphics/complex-domain-coloring
Discription: Domain coloring is a technique for visualizing complex functions. It represents the phase with a color hue value and the magnitude by brightness or saturation.
Link: Click this link to see the live chart or shape.
Template: Graphics/complex-domain-coloring
Discription: Domain coloring is a technique for visualizing complex functions. It represents the phase with a color hue value and the magnitude by brightness or saturation.
Link: Click this link to see the live chart or shape.
Template: Graphics/complex-domain-coloring
Discription: Domain coloring is a technique for visualizing complex functions. It represents the phase with a color hue value and the magnitude by brightness or saturation.
Link: Click this link to see the live chart or shape.
Template: Graphics/complex-domain-coloring
Discription: Domain coloring is a technique for visualizing complex functions. It represents the phase with a color hue value and the magnitude by brightness or saturation.
Link: Click this link to see the live chart or shape.
Template: Graphics/complex-domain-coloring
Discription: Domain coloring is a technique for visualizing complex functions. It represents the phase with a color hue value and the magnitude by brightness or saturation.
Link: Click this link to see the live chart or shape.
Template: Graphics/complex-domain-coloring
Discription: Domain coloring is a technique for visualizing complex functions. It represents the phase with a color hue value and the magnitude by brightness or saturation.
Link: Click this link to see the live chart or shape.
Template: Graphics/complex-domain-coloring
Discription: Domain coloring is a technique for visualizing complex functions. It represents the phase with a color hue value and the magnitude by brightness or saturation.
Link: Click this link to see the live chart or shape.
Template: Graphics/complex-domain-coloring
Discription: Domain coloring is a technique for visualizing complex functions. It represents the phase with a color hue value and the magnitude by brightness or saturation.
Link: Click this link to see the live chart or shape.
Template: Graphics/complex-domain-coloring
Discription: Domain coloring is a technique for visualizing complex functions. It represents the phase with a color hue value and the magnitude by brightness or saturation.
Link: Click this link to see the live chart or shape.
Template: Graphics/complex-domain-coloring
Discription: Domain coloring is a technique for visualizing complex functions. It represents the phase with a color hue value and the magnitude by brightness or saturation.
Link: Click this link to see the live chart or shape.
Template: Graphics/complex-domain-coloring
Discription: Domain coloring is a technique for visualizing complex functions. It represents the phase with a color hue value and the magnitude by brightness or saturation.
Link: Click this link to see the live chart or shape.
Template: Graphics/complex-domain-coloring
Discription: Domain coloring is a technique for visualizing complex functions. It represents the phase with a color hue value and the magnitude by brightness or saturation.
Link: Click this link to see the live chart or shape.