Template: Finance/stock-backtest-crossover
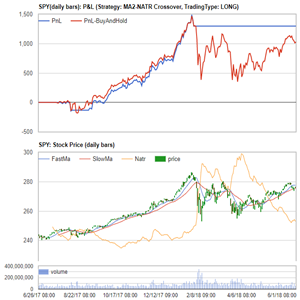
Discription: The template uses MA2-NATR crossover strategy that combines the MA2 crossover with the average true range indicator. The MA crossover indicates the strength and direction of the market trend, while true-range indicator is used to identify whether the market is in the trending region or not.
Link: Click this link to see the live chart or shape.

Template: Financestock-backtest-zscore
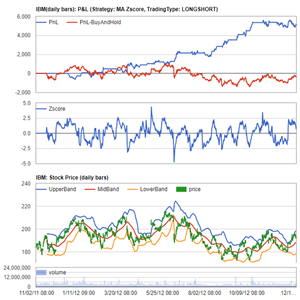
Discription: This template allows you to backtest the MA-Zscore strategy. This strategy uses the Bollinger band-like model based on the moving average.
Link: Click this link to see the live chart or shape.

Template: Finance/stock-backtest-zscore
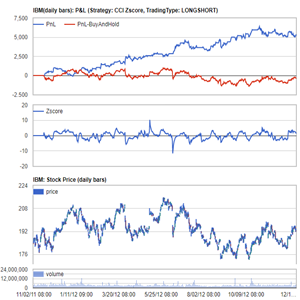
Discription: This strategy is based on CCI indicator. CCI measures the current price level relative to an average price level over a given period of time. It can be used to identify overbought and oversold levels. .
Link: Click this link to see the live chart or shape.
