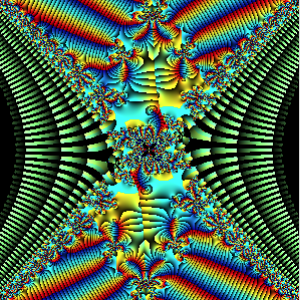
Template: Graphics/complex-iterated-function
Discription: Complex 28 patterns created based on the domain coloring for a complex function. Various patterns can be created by specifying different colormaps.
Link: Click this link to see the live chart or shape.
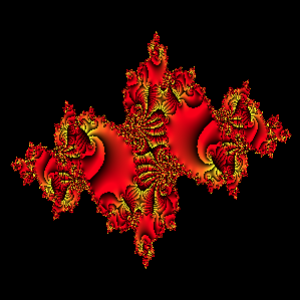
Template: Graphics/complex-iterated-function
Discription: Complex 29 patterns created based on the domain coloring for a complex function. Various patterns can be created by specifying different colormaps.
Link: Click this link to see the live chart or shape.
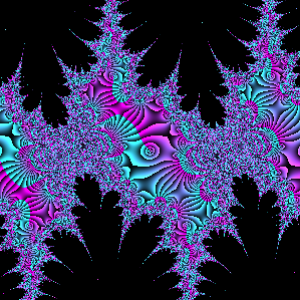
Template: Graphics/complex-iterated-function
Discription: Complex 30 patterns created based on the domain coloring for a complex function. Various patterns can be created by specifying different colormaps.
Link: Click this link to see the live chart or shape.
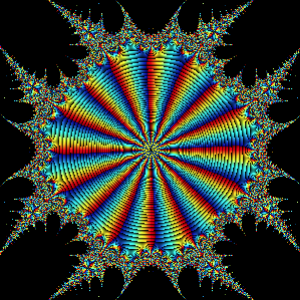
Template: Graphics/complex-iterated-function
Discription: Complex 31 patterns created based on the domain coloring for a complex function. Various patterns can be created by specifying different colormaps.
Link: Click this link to see the live chart or shape.
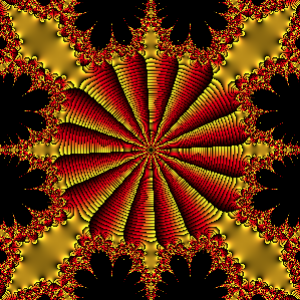
Template: Graphics/complex-iterated-function
Discription: Complex 32 patterns created based on the domain coloring for a complex function. Various patterns can be created by specifying different colormaps.
Link: Click this link to see the live chart or shape.
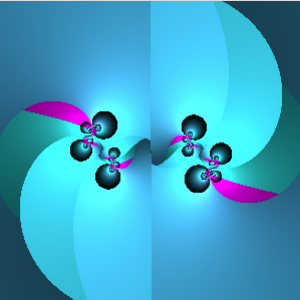
Template: Graphics/complex-iterated-function
Discription: Complex 33 patterns created based on the domain coloring for a complex function. Various patterns can be created by specifying different colormaps.
Link: Click this link to see the live chart or shape.
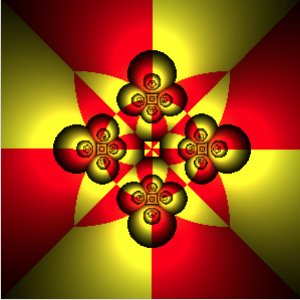
Template: Graphics/complex-iterated-function
Discription: Complex 34 patterns created based on the domain coloring for a complex function. Various patterns can be created by specifying different colormaps.
Link: Click this link to see the live chart or shape.
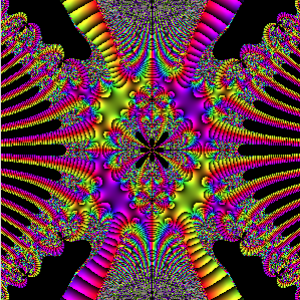
Template: Graphics/complex-iterated-function
Discription: Complex 35 patterns created based on the domain coloring for a complex function. Various patterns can be created by specifying different colormaps.
Link: Click this link to see the live chart or shape.
