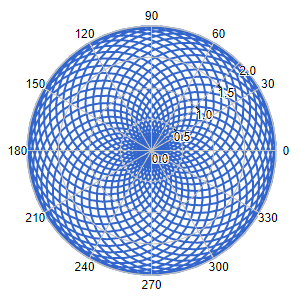
Template: Graphics/polar-chart
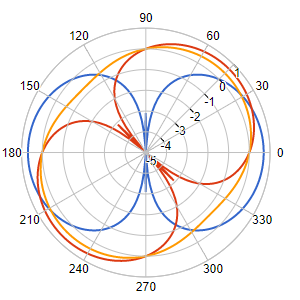
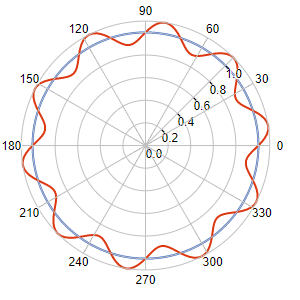
Discription: A polar chart is a circular plot on which data points are displayed using the angle (t), and the distance (r) from the center point.
Link: Click this link to see the live chart or shape.
Template: Graphics/polar-chart
Discription: A polar chart is a circular plot on which data points are displayed using the angle (t), and the distance (r) from the center point.
Link: Click this link to see the live chart or shape.
Template: Graphics/polar-chart
Discription: A polar chart is a circular plot on which data points are displayed using the angle (t), and the distance (r) from the center point.
Link: Click this link to see the live chart or shape.
Template: Graphics/polar-chart
Discription: A polar chart is a circular plot on which data points are displayed using the angle (t), and the distance (r) from the center point.
Link: Click this link to see the live chart or shape.
Template: Graphics/polar-chart
Discription: A polar chart is a circular plot on which data points are displayed using the angle (t), and the distance (r) from the center point.
Link: Click this link to see the live chart or shape.
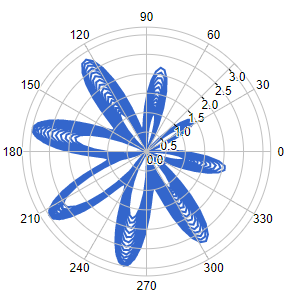
Template: Graphics/polar-chart
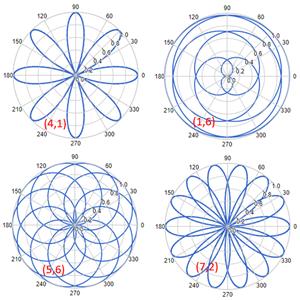
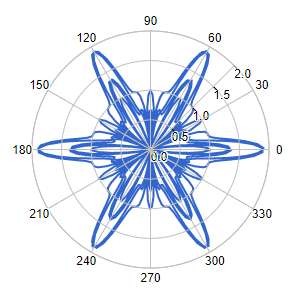
Discription: In mathematics, a rose or rhodonea curve is a sinusoid plotted in polar coordinates. These curves can be expressed by a polar equation of the form r = cos(a*t/b). You can create various rose curves by changing parameters a and b.
Link: Click this link to see the live chart or shape.