Template: Graphics/complex-3d-chart
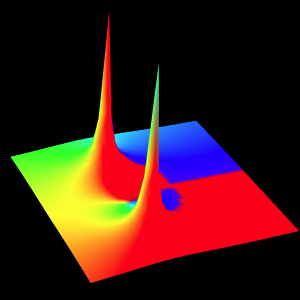
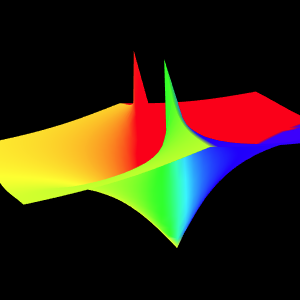
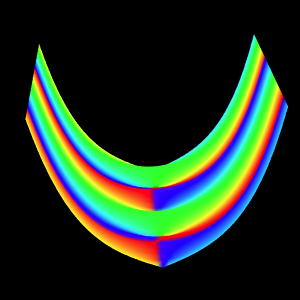
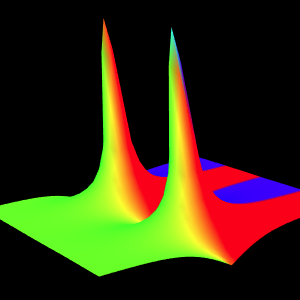
Discription: 3D chart for magnitude, real part, imaginary part, or phase of a specified complex-variable function over a complex plan.
Link: Click this link to see the live chart or shape.
Template: Graphics/complex-3d-chart
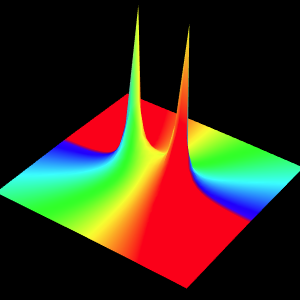
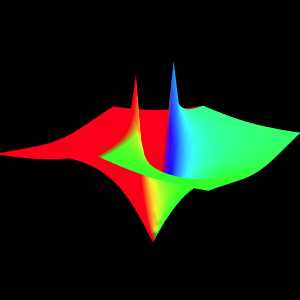
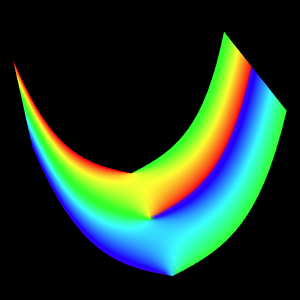
Discription: 3D chart for magnitude, real part, imaginary part, or phase of a specified complex-variable function over a complex plan.
Link: Click this link to see the live chart or shape.
Template: Graphics/complex-3d-chart
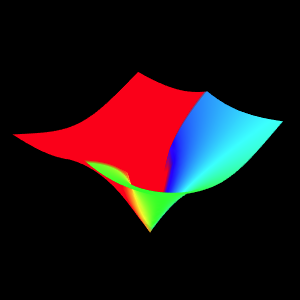
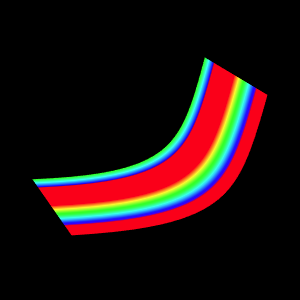
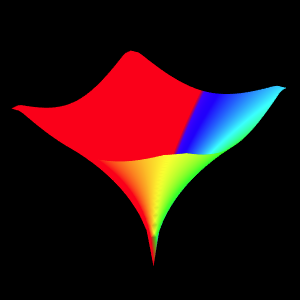
Discription: 3D chart for magnitude, real part, imaginary part, or phase of a specified complex-variable function over a complex plan.
Link: Click this link to see the live chart or shape.
Template: Graphics/complex-3d-chart
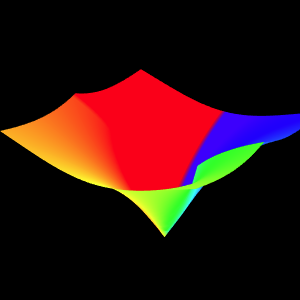
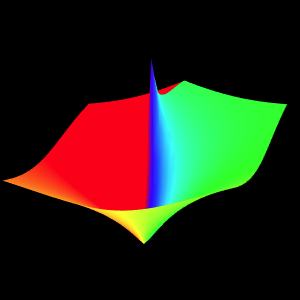
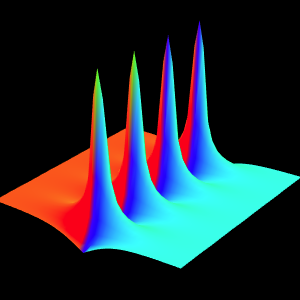
Discription: 3D chart for magnitude, real part, imaginary part, or phase of a specified complex-variable function over a complex plan.
Link: Click this link to see the live chart or shape.
Template: Graphics/complex-3d-chart
Discription: 3D chart for magnitude, real part, imaginary part, or phase of a specified complex-variable function over a complex plan.
Link: Click this link to see the live chart or shape.
Template: Graphics/complex-3d-chart
Discription: 3D chart for magnitude, real part, imaginary part, or phase of a specified complex-variable function over a complex plan.
Link: Click this link to see the live chart or shape.
Template: Graphics/complex-3d-chart
Discription: 3D chart for magnitude, real part, imaginary part, or phase of a specified complex-variable function over a complex plan.
Link: Click this link to see the live chart or shape.
Template: Graphics/complex-3d-chart
Discription: 3D chart for magnitude, real part, imaginary part, or phase of a specified complex-variable function over a complex plan.
Link: Click this link to see the live chart or shape.
Template: Graphics/complex-3d-chart
Discription: 3D chart for magnitude, real part, imaginary part, or phase of a specified complex-variable function over a complex plan.
Link: Click this link to see the live chart or shape.
Template: Graphics/complex-3d-chart
Discription: 3D chart for magnitude, real part, imaginary part, or phase of a specified complex-variable function over a complex plan.
Link: Click this link to see the live chart or shape.
Template: Graphics/complex-3d-chart
Discription: 3D chart for magnitude, real part, imaginary part, or phase of a specified complex-variable function over a complex plan.
Link: Click this link to see the live chart or shape.
Template: Graphics/complex-3d-chart
Discription: 3D chart for magnitude, real part, imaginary part, or phase of a specified complex-variable function over a complex plan.
Link: Click this link to see the live chart or shape.
Template: Graphics/complex-3d-chart
Discription: 3D chart for magnitude, real part, imaginary part, or phase of a specified complex-variable function over a complex plan.
Link: Click this link to see the live chart or shape.