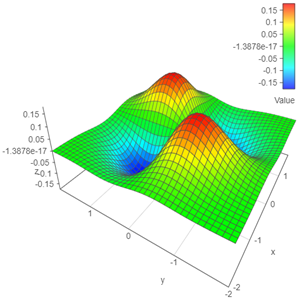
Template: Graphics/3d-simple-chart
Discription: This template creates a simple 3D chart for a mathematical peaks function with two variables or an x-y-z data set.
Link: Click this link to see the live chart or shape.
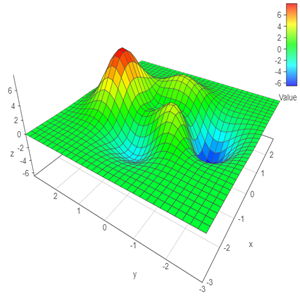
Template: Graphics/3d-simple-chart
Discription: This template creates a simple 3D chart for a mathematical sinc function with two variables or an x-y-z data set.
Link: Click this link to see the live chart or shape.
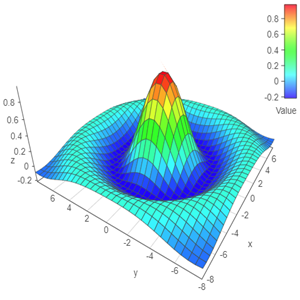
Template: Graphics/3d-simple-chart
Discription: This template creates a simple 3D chart for a mathematical sincXY function with two variables or an x-y-z data set.
Link: Click this link to see the live chart or shape.
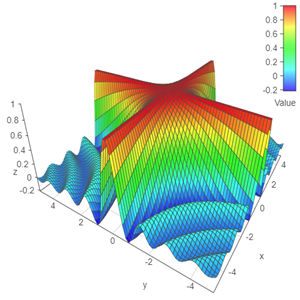
Template: Graphics/3d-simple-chart
Discription: This template creates a simple 3D sine and exponential chart for a mathematical function with two variables or an x-y-z data set.
Link: Click this link to see the live chart or shape.