Template: Graphics/2d-parametric-chart
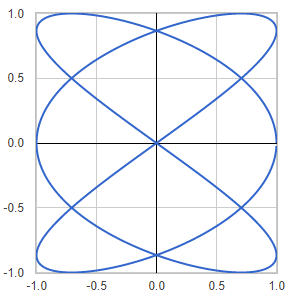
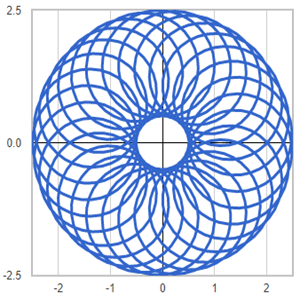
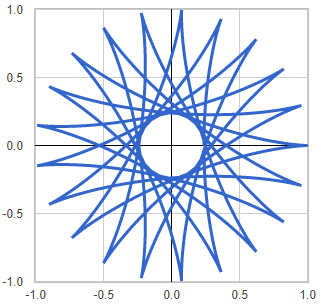
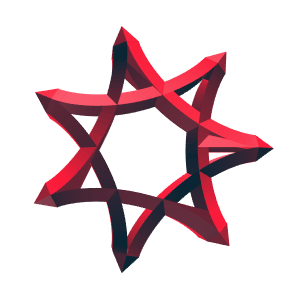
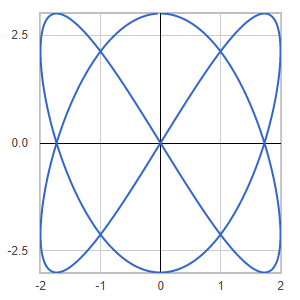
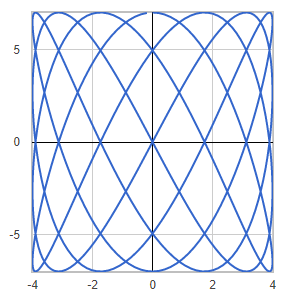
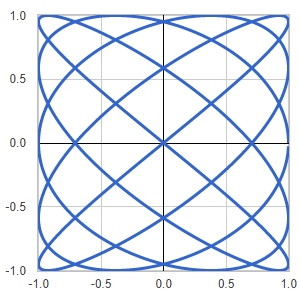
Discription: In mathematics, a Lissajous curve is a graph of a system of parametric equations that describe complex harmonic motion. The appearance of the curve is highly sensitive to the ratio of a/b .
Link: Click this link to see the live chart or shape.
Template: Graphics/complex-domain-coloring
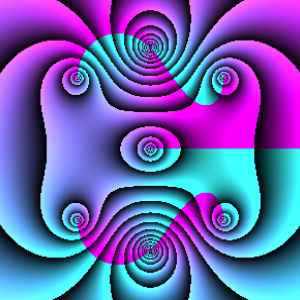
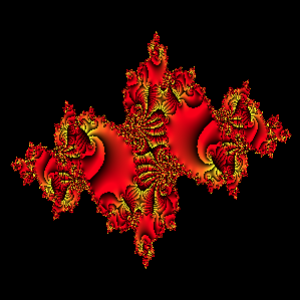
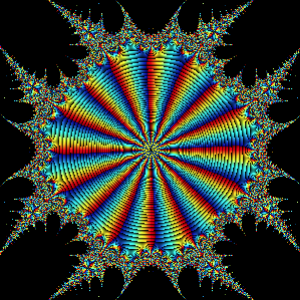
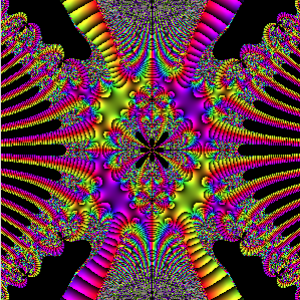
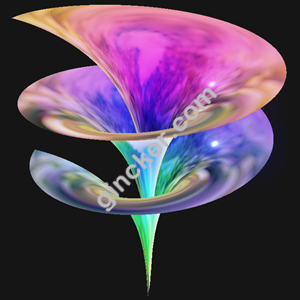
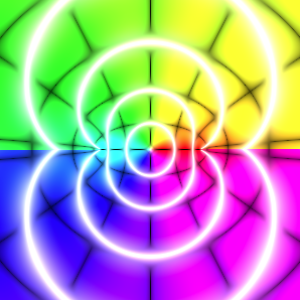
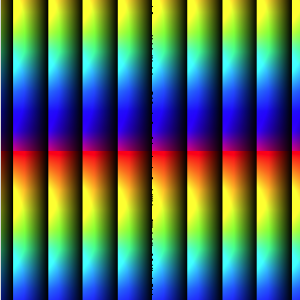
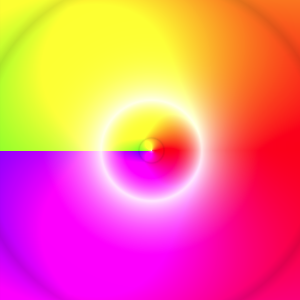
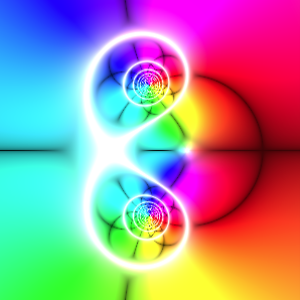
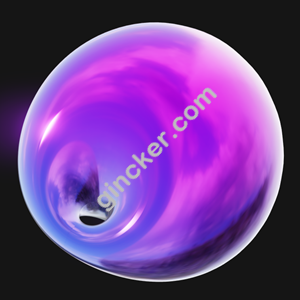
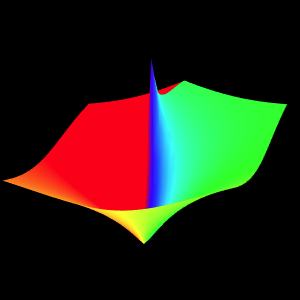
Discription: Domain coloring is a technique for visualizing complex functions. It represents the phase with a color hue value and the magnitude by brightness or saturation.
Link: Click this link to see the live chart or shape.
Template: Graphics/complex-domain-coloring
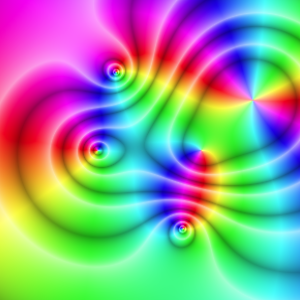
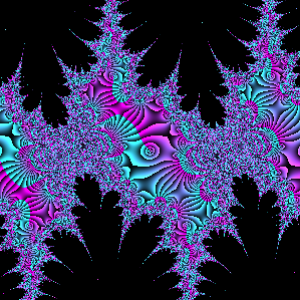
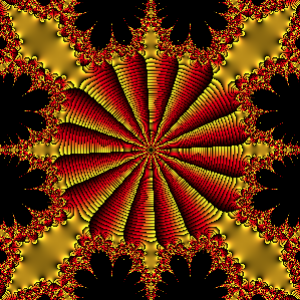
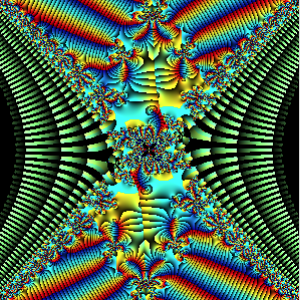
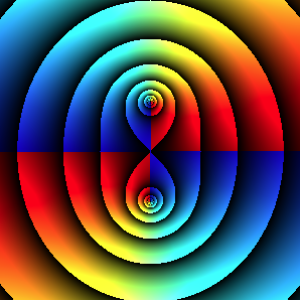
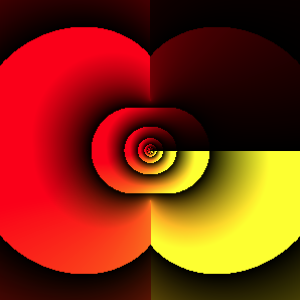
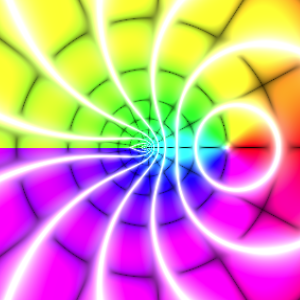
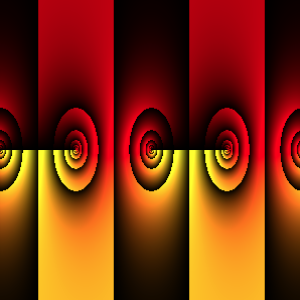
Discription: Domain coloring is a technique for visualizing complex functions. It represents the phase with a color hue value and the magnitude by brightness or saturation.
Link: Click this link to see the live chart or shape.
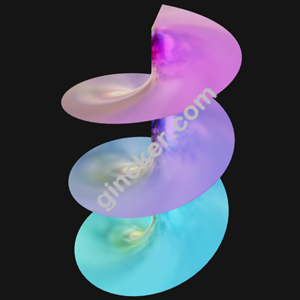
Template: Graphics/3d-line
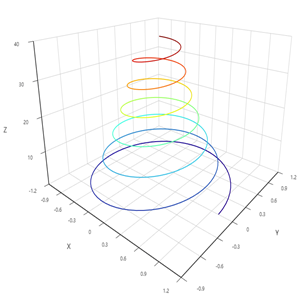
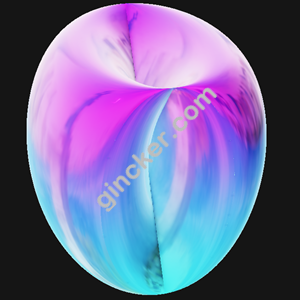
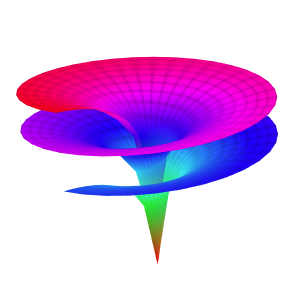
Discription: This template creates a 3d helicoid line using a set of parametric equations.
Link: Click this link to see the live chart or shape.
Template: Graphics/3d-line
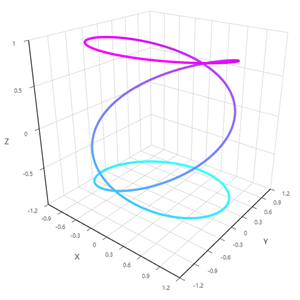
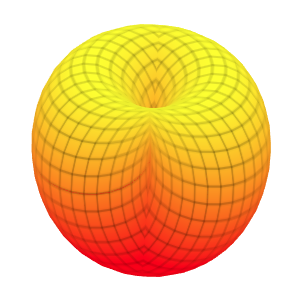
Discription: This templates creates a 3D parametric curve.
Link: Click this link to see the live chart or shape.
Template: Graphics/3d-line
Discription: This templates creates a 3D parametric curve.
Link: Click this link to see the live chart or shape.
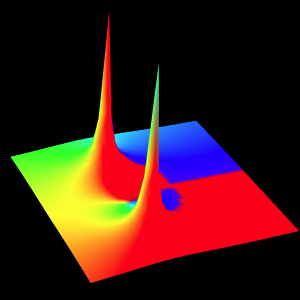
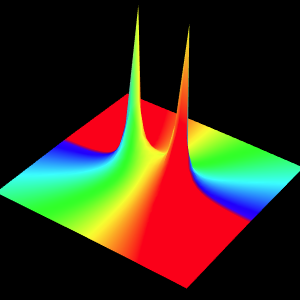
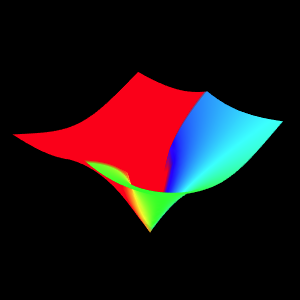
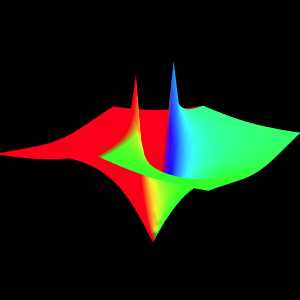
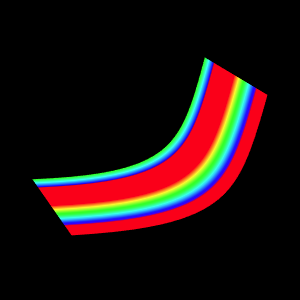
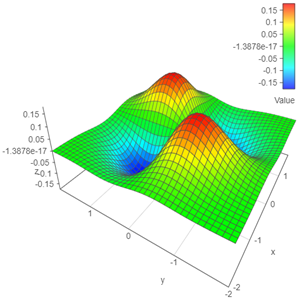
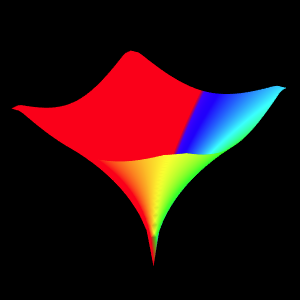
Template: Graphics/complex-3d-chart
Discription: 3D chart for magnitude, real part, imaginary part, or phase of a specified complex-variable function over a complex plan.
Link: Click this link to see the live chart or shape.
Template: Graphics/2d-parametric-chart
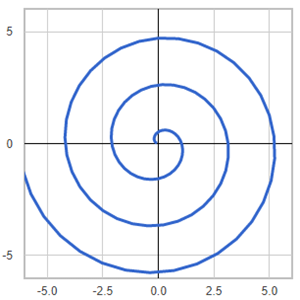
Discription: The Archemedean spiral is a spiral named after Greek mathematician Archimedes. It is the locus of points corresponding to the locations over time of a point moving away from a fixed point with a constant speed along a line rotates with constant angular velocity.
Link: Click this link to see the live chart or shape.
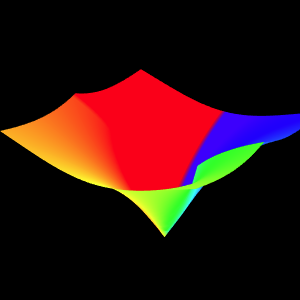
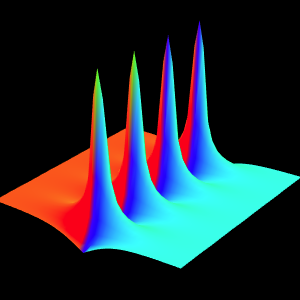
Template: Graphics/complex-3d-chart
Discription: 3D chart for magnitude, real part, imaginary part, or phase of a specified complex-variable function over a complex plan.
Link: Click this link to see the live chart or shape.
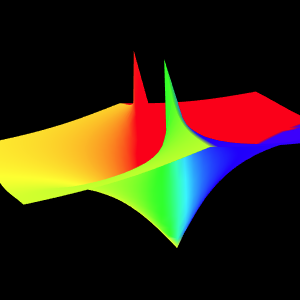
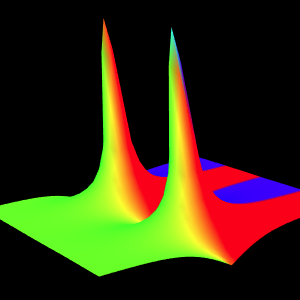
Template: Graphics/complex-3d-chart
Discription: 3D chart for magnitude, real part, imaginary part, or phase of a specified complex-variable function over a complex plan.
Link: Click this link to see the live chart or shape.
Template: Graphics/complex-3d-chart
Discription: 3D chart for magnitude, real part, imaginary part, or phase of a specified complex-variable function over a complex plan.
Link: Click this link to see the live chart or shape.
Template: Graphics/complex-3d-chart
Discription: 3D chart for magnitude, real part, imaginary part, or phase of a specified complex-variable function over a complex plan.
Link: Click this link to see the live chart or shape.
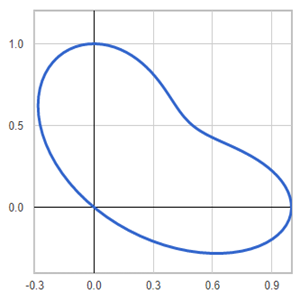
Template: Graphics/2d-parametric-chart
Discription: Bean shape created using 2D parametric equations.
Link: Click this link to see the live chart or shape.
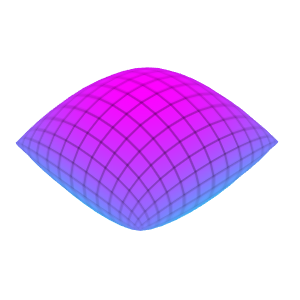
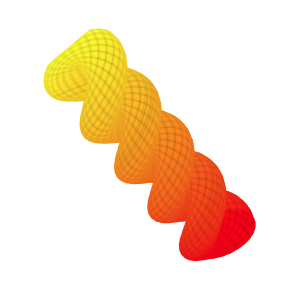
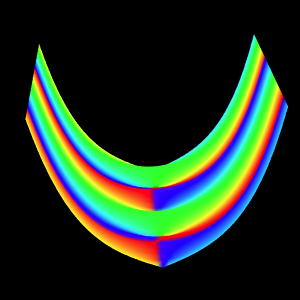
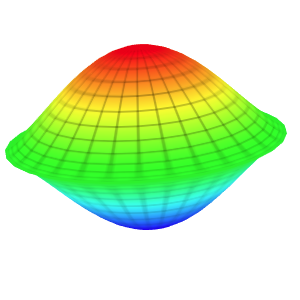
Template: Graphics/3d-parametric-chart
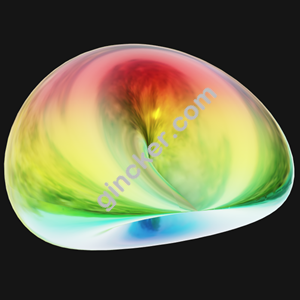
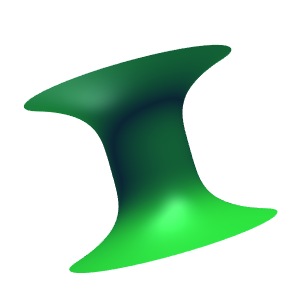
Discription: This template creates a parametric Bouligand cushion surface with a set of parametric equations.
Link: Click this link to see the live chart or shape.
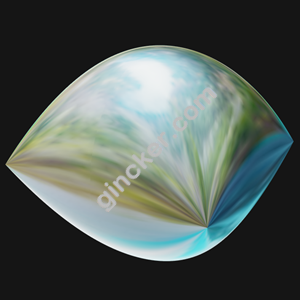
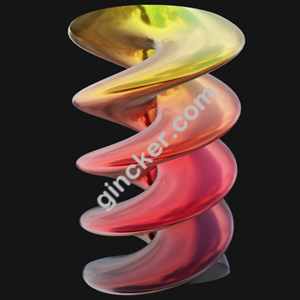
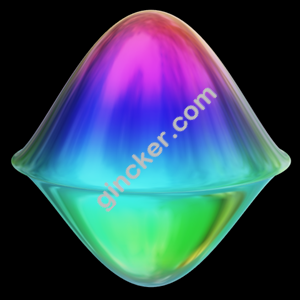
Template: Graphics/3d-parametric-shape
Discription: This template creates a parametric Bouligand cushion shape with a set of parametric equations.
Link: Click this link to see the live chart or shape.
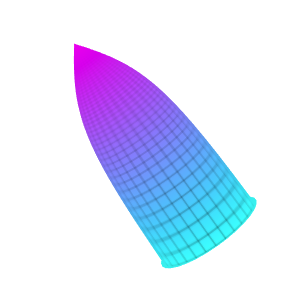
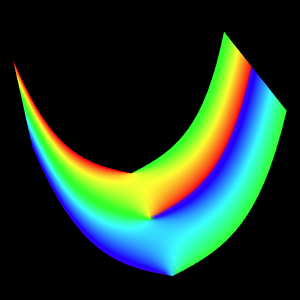
Template: Graphics/3d-parametric-chart
Discription: This template creates a parametric bullet nose surface with a set of parametric equations.
Link: Click this link to see the live chart or shape.
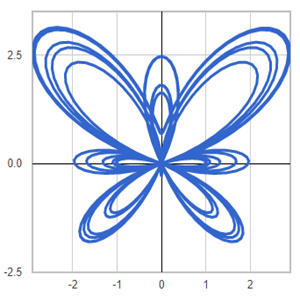
Template: Graphics/2d-parametric-chart
Discription: Butterfly shape created using 2D parametric equations.
Link: Click this link to see the live chart or shape.
Template: Graphics/3d-parametric-shape
Discription: The circled helicoid can be generated by the helical movement of a circle. This surface is created by extending a sphere along a diameter and then twisting.
Link: Click this link to see the live chart or shape.
Template: Graphics/3d-parametric-chart
Discription: The circled helicoid can be generated by the helical movement of a circle. This surface is created by extending a sphere along a diameter and then twisting.
Link: Click this link to see the live chart or shape.
Template: Graphics/2d-parametric-chart
Discription: Circles created using 2D parametric equations.
Link: Click this link to see the live chart or shape.
Template: Graphics/2d-parametric-chart
Discription: Circular shape created using 2D parametric equations.
Link: Click this link to see the live chart or shape.
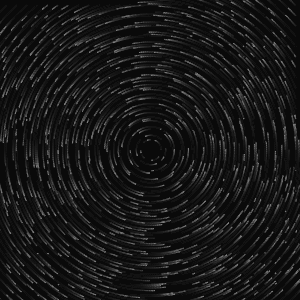
Template: Graphics/complex-iterated-function
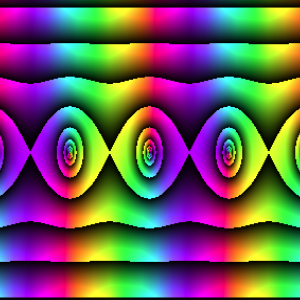
Discription: Complex 28 patterns created based on the domain coloring for a complex function. Various patterns can be created by specifying different colormaps.
Link: Click this link to see the live chart or shape.
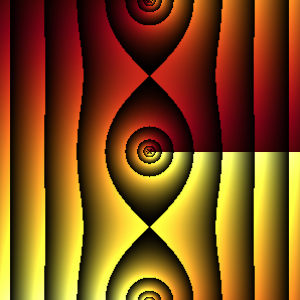
Template: Graphics/complex-iterated-function
Discription: Complex 29 patterns created based on the domain coloring for a complex function. Various patterns can be created by specifying different colormaps.
Link: Click this link to see the live chart or shape.
Template: Graphics/complex-iterated-function
Discription: Complex 30 patterns created based on the domain coloring for a complex function. Various patterns can be created by specifying different colormaps.
Link: Click this link to see the live chart or shape.
Template: Graphics/complex-iterated-function
Discription: Complex 31 patterns created based on the domain coloring for a complex function. Various patterns can be created by specifying different colormaps.
Link: Click this link to see the live chart or shape.
Template: Graphics/complex-iterated-function
Discription: Complex 32 patterns created based on the domain coloring for a complex function. Various patterns can be created by specifying different colormaps.
Link: Click this link to see the live chart or shape.
Template: Graphics/complex-iterated-function
Discription: Complex 33 patterns created based on the domain coloring for a complex function. Various patterns can be created by specifying different colormaps.
Link: Click this link to see the live chart or shape.
Template: Graphics/complex-iterated-function
Discription: Complex 34 patterns created based on the domain coloring for a complex function. Various patterns can be created by specifying different colormaps.
Link: Click this link to see the live chart or shape.
Template: Graphics/complex-iterated-function
Discription: Complex 35 patterns created based on the domain coloring for a complex function. Various patterns can be created by specifying different colormaps.
Link: Click this link to see the live chart or shape.
Template: Graphics/3d-parametric-shape
Discription: This template creates a 3D surface with a set of parametric cosine-sine equations
Link: Click this link to see the live chart or shape.
Template: Graphics/3d-parametric-chart
Discription: This template creates a 3D surface with a set of parametric cosine-sine equations
Link: Click this link to see the live chart or shape.
Template: Graphics/3d-parametric-shape
Discription: Cross-gap is a representation of the projective plane. It is like a shrinked torus where there is no middle hole and the side has been pinched together in such a way that the top cross to the bottom.
Link: Click this link to see the live chart or shape.
Template: Graphics/3d-parametric-chart
Discription: Cross-gap is a representation of the projective plane. It is like a shrinked torus where there is no middle hole and the side has been pinched together in such a way that the top cross to the bottom.
Link: Click this link to see the live chart or shape.
Template: Graphics/2d-parametric-chart
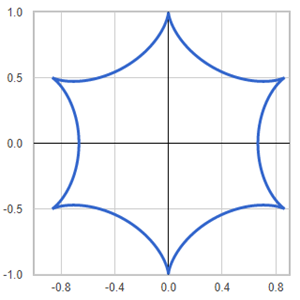
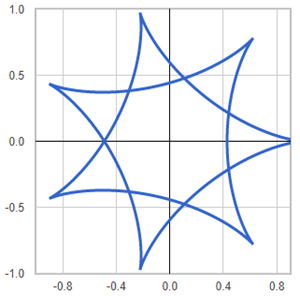
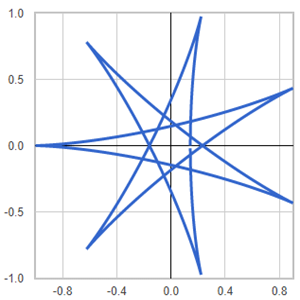
Discription: Cycloid is the trace of a point on a circle rolling upon another circle without slipping. When a circle is rolling externally upon a fixed circle - in the same manner a coin rolls around another - we have epicycloid. When the rolling is internal, we have hypocycloid.
Link: Click this link to see the live chart or shape.
Template: Graphics/2d-parametric-chart
Discription: Cycloid is the trace of a point on a circle rolling upon another circle without slipping. When a circle is rolling externally upon a fixed circle - in the same manner a coin rolls around another - we have epicycloid. When the rolling is internal, we have hypocycloid.
Link: Click this link to see the live chart or shape.
Template: Graphics/3d-parametric-shape
Discription: Dini shape is a surface with constant negative curvature that can be created by twisting a pseudosphere. It is named after Ulisse Dini.
Link: Click this link to see the live chart or shape.
Template: Graphics/3d-parametric-chart
Discription: Dini surface is a surface with constant negative curvature that can be created by twisting a pseudosphere. It is named after Ulisse Dini.
Link: Click this link to see the live chart or shape.
Template: Graphics/complex-domain-coloring
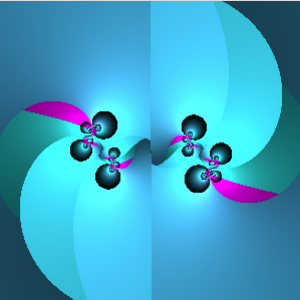
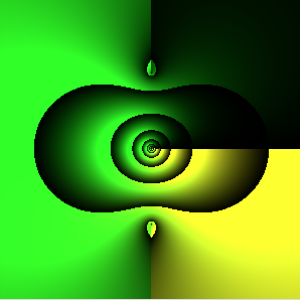
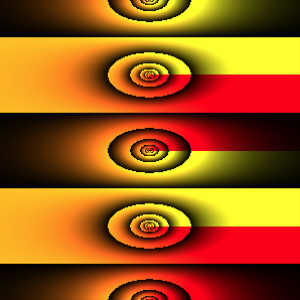
Discription: Domain coloring is a technique for visualizing complex functions. It represents the phase with a color hue value and the magnitude by brightness or saturation.
Link: Click this link to see the live chart or shape.
Template: Graphics/complex-domain-coloring
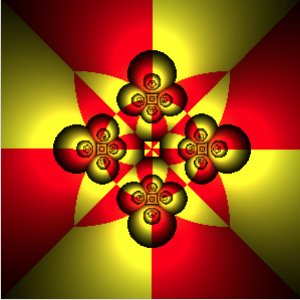
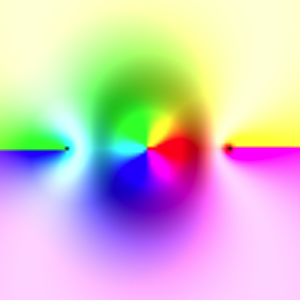
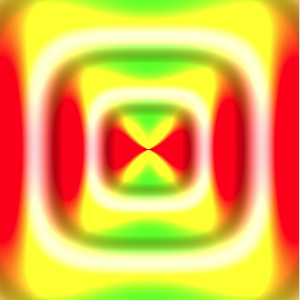
Discription: Domain coloring is a technique for visualizing complex functions. It represents the phase with a color hue value and the magnitude by brightness or saturation.
Link: Click this link to see the live chart or shape.
Template: Graphics/complex-domain-coloring
Discription: Domain coloring is a technique for visualizing complex functions. It represents the phase with a color hue value and the magnitude by brightness or saturation.
Link: Click this link to see the live chart or shape.
Template: Graphics/complex-domain-coloring
Discription: Domain coloring is a technique for visualizing complex functions. It represents the phase with a color hue value and the magnitude by brightness or saturation.
Link: Click this link to see the live chart or shape.
Template: Graphics/complex-domain-coloring
Discription: Domain coloring is a technique for visualizing complex functions. It represents the phase with a color hue value and the magnitude by brightness or saturation.
Link: Click this link to see the live chart or shape.
Template: Graphics/complex-domain-coloring
Discription: Domain coloring is a technique for visualizing complex functions. It represents the phase with a color hue value and the magnitude by brightness or saturation.
Link: Click this link to see the live chart or shape.
Template: Graphics/complex-domain-coloring
Discription: Domain coloring is a technique for visualizing complex functions. It represents the phase with a color hue value and the magnitude by brightness or saturation.
Link: Click this link to see the live chart or shape.
Template: Graphics/complex-domain-coloring
Discription: Domain coloring is a technique for visualizing complex functions. It represents the phase with a color hue value and the magnitude by brightness or saturation.
Link: Click this link to see the live chart or shape.
Template: Graphics/complex-domain-coloring
Discription: Domain coloring is a technique for visualizing complex functions. It represents the phase with a color hue value and the magnitude by brightness or saturation.
Link: Click this link to see the live chart or shape.
Template: Graphics/complex-domain-coloring
Discription: Domain coloring is a technique for visualizing complex functions. It represents the phase with a color hue value and the magnitude by brightness or saturation.
Link: Click this link to see the live chart or shape.
Template: Graphics/complex-domain-coloring
Discription: Domain coloring is a technique for visualizing complex functions. It represents the phase with a color hue value and the magnitude by brightness or saturation.
Link: Click this link to see the live chart or shape.
Template: Graphics/complex-domain-coloring
Discription: Domain coloring is a technique for visualizing complex functions. It represents the phase with a color hue value and the magnitude by brightness or saturation.
Link: Click this link to see the live chart or shape.
Template: Graphics/complex-domain-coloring
Discription: Domain coloring is a technique for visualizing complex functions. It represents the phase with a color hue value and the magnitude by brightness or saturation.
Link: Click this link to see the live chart or shape.
Template: Graphics/complex-domain-coloring
Discription: Domain coloring is a technique for visualizing complex functions. It represents the phase with a color hue value and the magnitude by brightness or saturation.
Link: Click this link to see the live chart or shape.
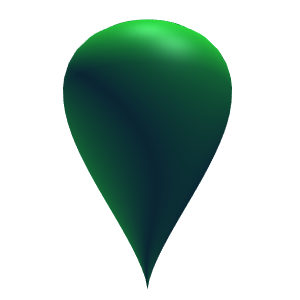
Template: Graphics/3d-parametric-shape
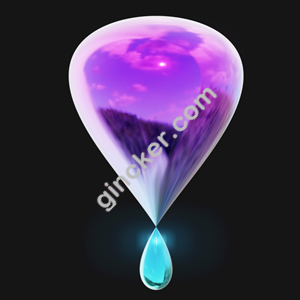
Discription: This template creates a drop shape with a set of parametric equations.
Link: Click this link to see the live chart or shape.
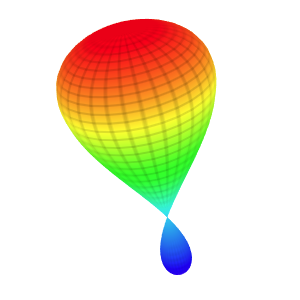
Template: Graphics/3d-parametric-chart
Discription: This template creates a drop surface with a set of parametric equations.
Link: Click this link to see the live chart or shape.
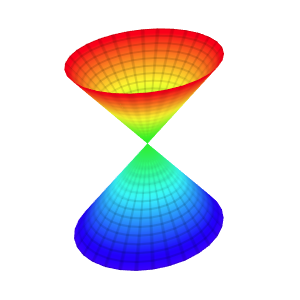
Template: Graphics/3d-parametric-shape
Discription: An elliptic cone is a type of quadric surfaces. A quadric surface is a generalization of conic sections (ellipses, parabolas, and hyperbolas).
Link: Click this link to see the live chart or shape.
Template: Graphics/3d-parametric-chart
Discription: An elliptic cone is a type of quadric surfaces. A quadric surface is a generalization of conic sections (ellipses, parabolas, and hyperbolas).
Link: Click this link to see the live chart or shape.
Template: Graphics/3d-parametric-shape
Discription: Elliptic cyclide is a type of Dupin cyclides. Dupin cyclide is any geometric inversion of a standard torus, cylinder, or double cone. Dupin cyclides are natural objects in Lie sphere geometry.
Link: Click this link to see the live chart or shape.
Template: Graphics/3d-parametric-chart
Discription: Elliptic cyclide is a type of Dupin cyclides. Dupin cyclide is any geometric inversion of a standard torus, cylinder, or double cone. Dupin cyclides are natural objects in Lie sphere geometry.
Link: Click this link to see the live chart or shape.
Template: Graphics/complex-3d-chart
Discription: 3D chart for magnitude, real part, imaginary part, or phase of a specified complex-variable function over a complex plan.
Link: Click this link to see the live chart or shape.
Template: Graphics/3d-extruded-shape
Discription: 3D extruded beans shape created from a path shape using a set of parametric equations.
Link: Click this link to see the live chart or shape.

Template: Graphics/3d-extruded-shape
Discription: 3D extruded circle created from a path shape using a set of parametric equations.
Link: Click this link to see the live chart or shape.

Template: Graphics/3d-extruded-shape
Discription: Extruded cyclide created from a path shape using a set of parametric equations. You can create a variety of cyclides by specifying different sets of parameters.
Link: Click this link to see the live chart or shape.
Template: Graphics/3d-extruded-shape
Discription: Extruded flower shape created from a path shape using a set of parametric equations.
Link: Click this link to see the live chart or shape.

Template: Graphics/3d-extruded-shape
Discription: Extruded heart shape created from a path shape using a set of parametric equations.
Link: Click this link to see the live chart or shape.

Template: Graphics/2d-parametric-chart
Discription: Flower shape created using 2D parametric equations.
Link: Click this link to see the live chart or shape.
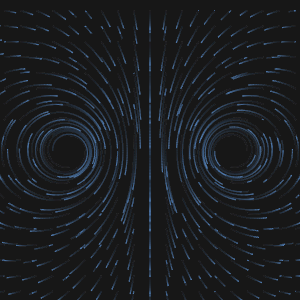
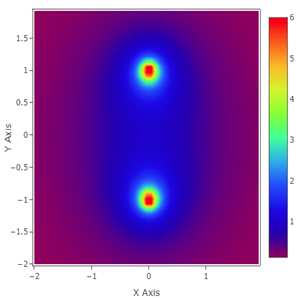
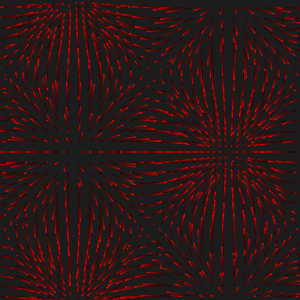
Template: Graphics/vector-chart-from-vector-potential
Discription: Vector chart of the magnetic field distribution created using the vector potential for a pair of long parallel current wires.
Link: Click this link to see the live chart or shape.
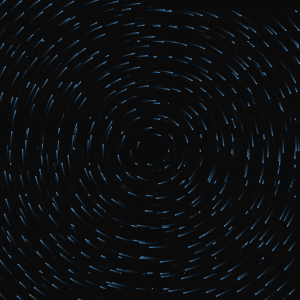
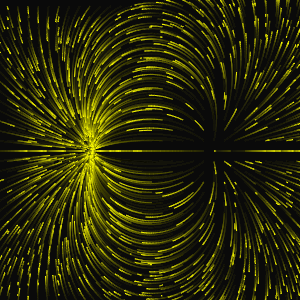
Template: Graphics/vector-chart-from-vector-potential
Discription: Vector chart of the magnetic field distribution created using the vector potential for a current wire.
Link: Click this link to see the live chart or shape.
Template: Graphics/3d-parametric-shape
Discription: The Globoid surface can be generated by rotation of an arc of the circle about the z-axis lying at the plane of the arc.
Link: Click this link to see the live chart or shape.
Template: Graphics/3d-parametric-chart
Discription: The Globoid surface can be generated by rotation of an arc of the circle about the z-axis lying at the plane of the arc.
Link: Click this link to see the live chart or shape.
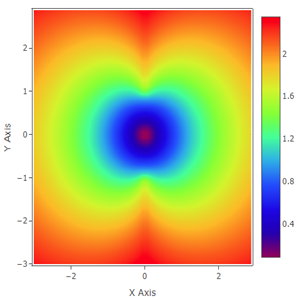
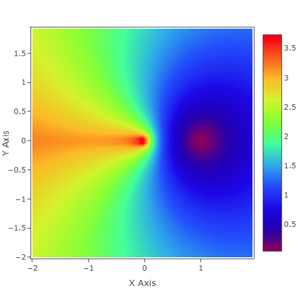
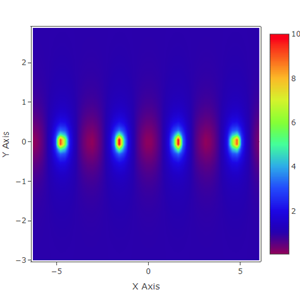
Template: Graphics/complex-heatmap
Discription: Heatmap chart for magnitude, real part, imaginary part, or phase of a specified complex-variable function over a complex plan.
Link: Click this link to see the live chart or shape.
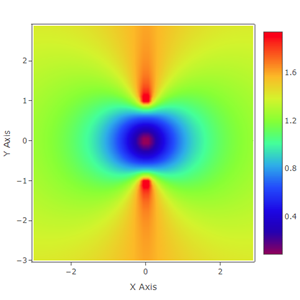
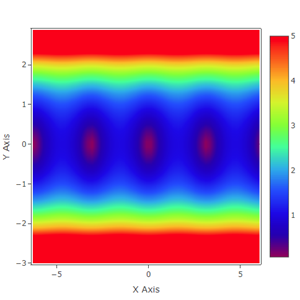
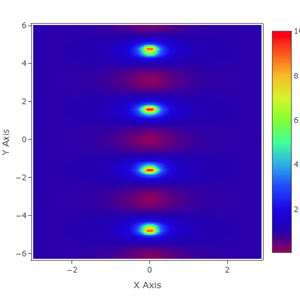
Template: Graphics/complex-heatmap
Discription: Heatmap chart for magnitude, real part, imaginary part, or phase of a specified complex-variable function over a complex plan.
Link: Click this link to see the live chart or shape.
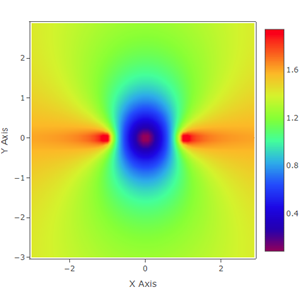
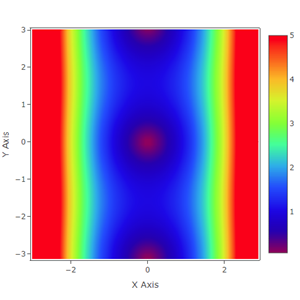
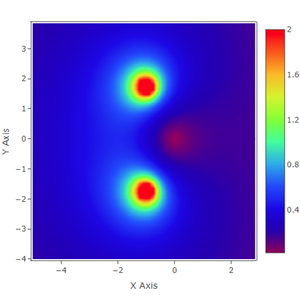
Template: Graphics/complex-heatmap
Discription: Heatmap chart for magnitude, real part, imaginary part, or phase of a specified complex-variable function over a complex plan.
Link: Click this link to see the live chart or shape.
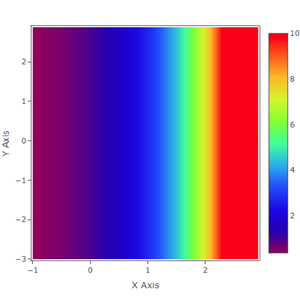
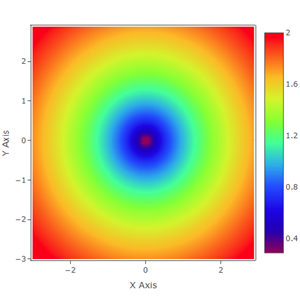
Template: Graphics/complex-heatmap
Discription: Heatmap chart for magnitude, real part, imaginary part, or phase of a specified complex-variable function over a complex plan.
Link: Click this link to see the live chart or shape.
Template: Graphics/complex-heatmap
Discription: Heatmap chart for magnitude, real part, imaginary part, or phase of a specified complex-variable function over a complex plan.
Link: Click this link to see the live chart or shape.
Template: Graphics/complex-heatmap
Discription: Heatmap chart for magnitude, real part, imaginary part, or phase of a specified complex-variable function over a complex plan.
Link: Click this link to see the live chart or shape.
Template: Graphics/complex-heatmap
Discription: Heatmap chart for magnitude, real part, imaginary part, or phase of a specified complex-variable function over a complex plan.
Link: Click this link to see the live chart or shape.
Template: Graphics/complex-heatmap
Discription: Heatmap chart for magnitude, real part, imaginary part, or phase of a specified complex-variable function over a complex plan.
Link: Click this link to see the live chart or shape.
Template: Graphics/complex-heatmap
Discription: Heatmap chart for magnitude, real part, imaginary part, or phase of a specified complex-variable function over a complex plan.
Link: Click this link to see the live chart or shape.
Template: Graphics/complex-heatmap
Discription: Heatmap chart for magnitude, real part, imaginary part, or phase of a specified complex-variable function over a complex plan.
Link: Click this link to see the live chart or shape.
Template: Graphics/complex-heatmap
Discription: Heatmap chart for magnitude, real part, imaginary part, or phase of a specified complex-variable function over a complex plan.
Link: Click this link to see the live chart or shape.
Template: Graphics/complex-heatmap
Discription: Heatmap chart for magnitude, real part, imaginary part, or phase of a specified complex-variable function over a complex plan.
Link: Click this link to see the live chart or shape.
Template: Graphics/complex-heatmap
Discription: Heatmap chart for magnitude, real part, imaginary part, or phase of a specified complex-variable function over a complex plan.
Link: Click this link to see the live chart or shape.
Template: Graphics/3d-parametric-shape
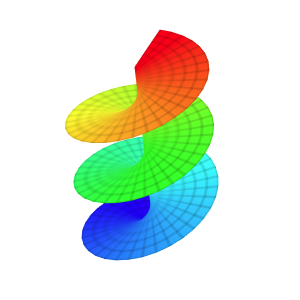
Discription: A helicoid is a trace of a line. For any point on the surface, there is a line on the surface passing through it. Helicoids are shaped like screws and can be described be a set of parametric equations.
Link: Click this link to see the live chart or shape.
Template: Graphics/3d-parametric-chart
Discription: A helicoid is a trace of a line. For any point on the surface, there is a line on the surface passing through it. Helicoids are shaped like screws and can be described be a set of parametric equations.
Link: Click this link to see the live chart or shape.
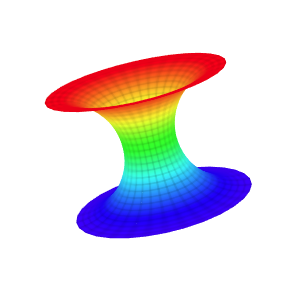
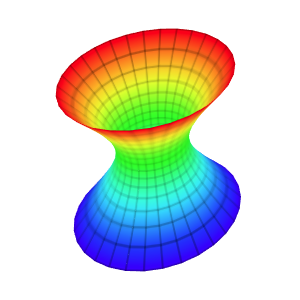
Template: Graphics/3d-parametric-chart
Discription: In geometry, a hyperboloid is a type of quadric surfaces. A quadric surface is a generalization of conic sections (ellipses, parabolas, and hyperbolas).
Link: Click this link to see the live chart or shape.
Template: Graphics/3d-parametric-shape
Discription: A Klein bottle is an example of a non-orientable surface. It is a 2D manifold against which a system for determining a normal vector cannot be consistently defined. It is a one-side surface that, if traveled upon, could be followed back to the point of origin while flipping the traveler upside down.
Link: Click this link to see the live chart or shape.

Template: Graphics/3d-parametric-chart
Discription: A Klein bottle is an example of a non-orientable surface. It is a 2D manifold against which a system for determining a normal vector cannot be consistently defined. It is a one-side surface that, if traveled upon, could be followed back to the point of origin while flipping the traveler upside down.
Link: Click this link to see the live chart or shape.
Template: Graphics/2d-parametric-chart
Discription: Lattice shape created using 2D parametric equations.
Link: Click this link to see the live chart or shape.
Template: Graphics/2d-parametric-chart
Discription: Lattice shape created using 2D parametric equations.
Link: Click this link to see the live chart or shape.
Template: Graphics/2d-parametric-chart
Discription: Lattice shape created using 2D parametric equations.
Link: Click this link to see the live chart or shape.
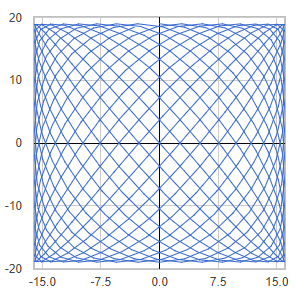
Template: Graphics/2d-parametric-chart
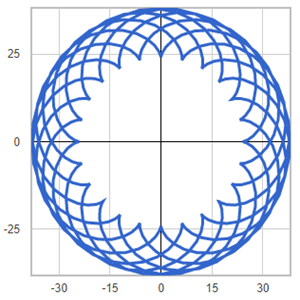
Discription: In mathematics, a Lissajous curve is a graph of a system of parametric equations that describe complex harmonic motion. The appearance of the curve is highly sensitive to the ratio of a/b .
Link: Click this link to see the live chart or shape.
Template: Graphics/complex-3d-chart
Discription: 3D chart for magnitude, real part, imaginary part, or phase of a specified complex-variable function over a complex plan.
Link: Click this link to see the live chart or shape.
Template: Graphics/3d-parametric-chart
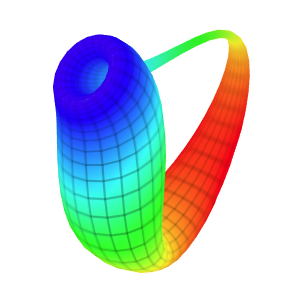
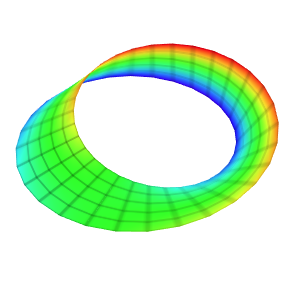
Discription: The Moebius strip is a surface with only one side. It has the mathematical property of being unorientable. It can be realized as a ruled surface. It has Euler characteristic of 0.
Link: Click this link to see the live chart or shape.
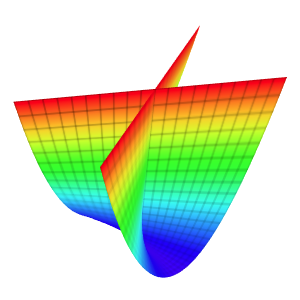
Template: Graphics/3d-parametric-chart
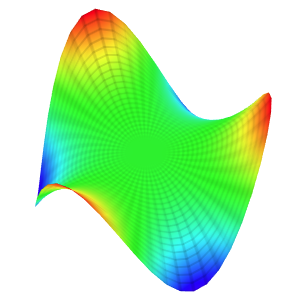
Discription: The monkey saddle surface belongs to the class of saddle surfaces and its name derives from the observation that a saddle for a monkey requires three depressions: two for the legs, and one for the tail.
Link: Click this link to see the live chart or shape.
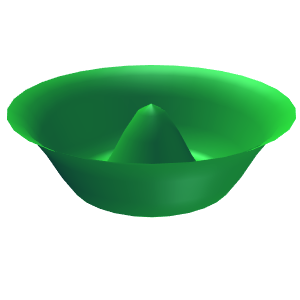
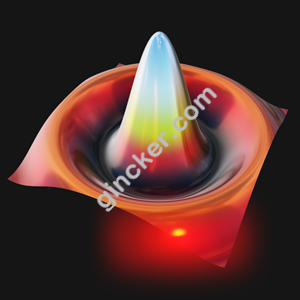
Template: Graphics/3d-parametric-shape
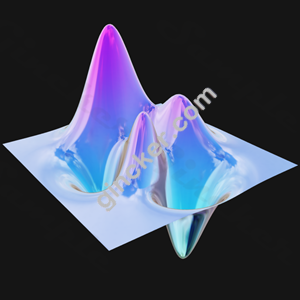
Discription: This template creates a simple 3D shape for a mathematical peaks function with two parametric variables u and v.
Link: Click this link to see the live chart or shape.
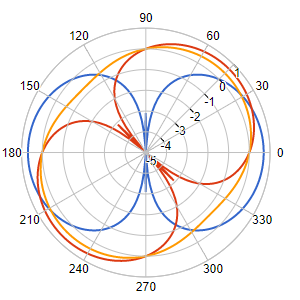
Template: Graphics/polar-chart
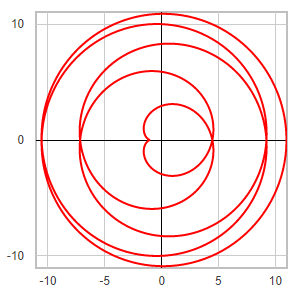
Discription: A polar chart is a circular plot on which data points are displayed using the angle (t), and the distance (r) from the center point.
Link: Click this link to see the live chart or shape.
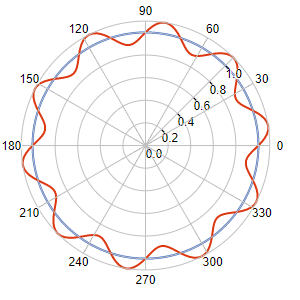
Template: Graphics/polar-chart
Discription: A polar chart is a circular plot on which data points are displayed using the angle (t), and the distance (r) from the center point.
Link: Click this link to see the live chart or shape.
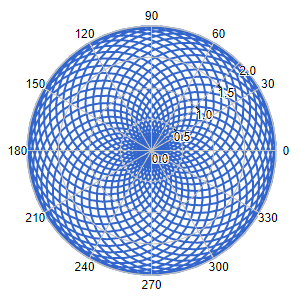
Template: Graphics/polar-chart
Discription: A polar chart is a circular plot on which data points are displayed using the angle (t), and the distance (r) from the center point.
Link: Click this link to see the live chart or shape.
Template: Graphics/polar-chart
Discription: A polar chart is a circular plot on which data points are displayed using the angle (t), and the distance (r) from the center point.
Link: Click this link to see the live chart or shape.
Template: Graphics/polar-chart
Discription: A polar chart is a circular plot on which data points are displayed using the angle (t), and the distance (r) from the center point.
Link: Click this link to see the live chart or shape.
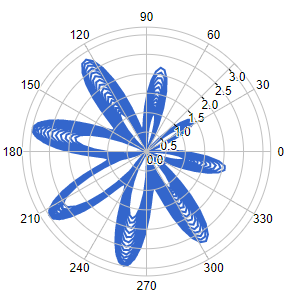
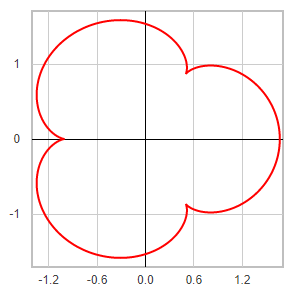
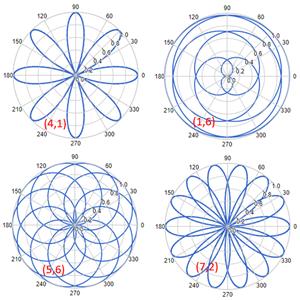
Template: Graphics/polar-chart
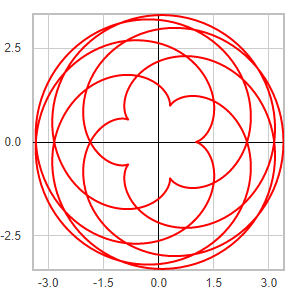
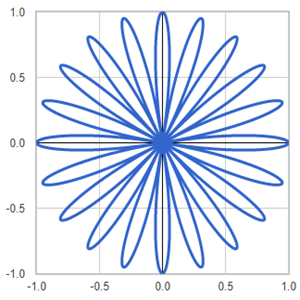
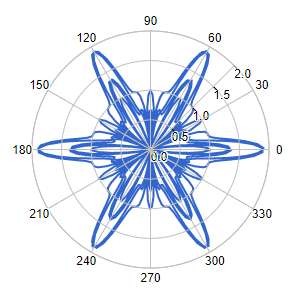
Discription: In mathematics, a rose or rhodonea curve is a sinusoid plotted in polar coordinates. These curves can be expressed by a polar equation of the form r = cos(a*t/b). You can create various rose curves by changing parameters a and b.
Link: Click this link to see the live chart or shape.
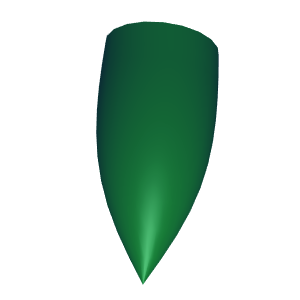
Template: Graphics/3d-shape-of-revolution
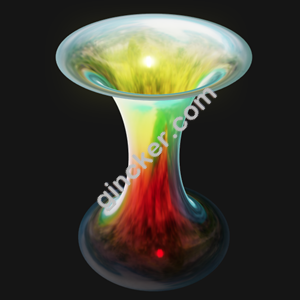
Discription: Bullet shape created by rotating a plan curve described using a set of parametric equations around a rotation axis that lies on the same plan.
Link: Click this link to see the live chart or shape.
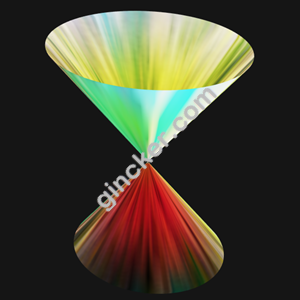
Template: Graphics/3d-shape-of-revolution
Discription: Cone shape created by rotating a plan curve described using a set of parametric equations around a rotation axis that lies on the same plan.
Link: Click this link to see the live chart or shape.

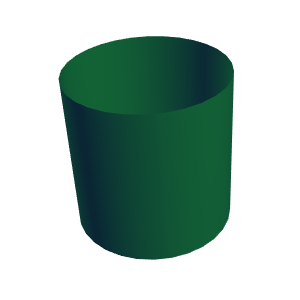
Template: Graphics/3d-shape-of-revolution
Discription: Conical frustrum shape created by rotating a plan curve described using a set of parametric equations around a rotation axis that lies on the same plan.
Link: Click this link to see the live chart or shape.

Template: Graphics/3d-shape-of-revolution
Discription: Cosine shape created by rotating a plan curve described using a set of parametric equations around a rotation axis that lies on the same plan.
Link: Click this link to see the live chart or shape.
Template: Graphics/3d-shape-of-revolution
Discription: Another cosine shape created by rotating a plan curve described using a set of parametric equations around a rotation axis that lies on the same plan.
Link: Click this link to see the live chart or shape.
Template: Graphics/3d-shape-of-revolution
Discription: Cylinder shape created by rotating a plan curve described using a set of parametric equations around a rotation axis that lies on the same plan.
Link: Click this link to see the live chart or shape.
Template: Graphics/3d-shape-of-revolution
Discription: Egg shape created by rotating a plan curve described using a set of parametric equations around a rotation axis that lies on the same plan.
Link: Click this link to see the live chart or shape.
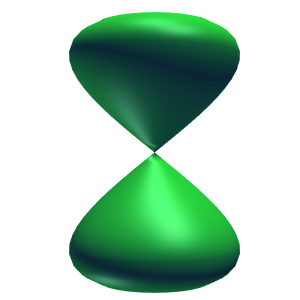
Template: Graphics/3d-shape-of-revolution
Discription: Eight figure created by rotating a plan curve described using a set of parametric equations around a rotation axis that lies on the same plan.
Link: Click this link to see the live chart or shape.
Template: Graphics/3d-shape-of-revolution
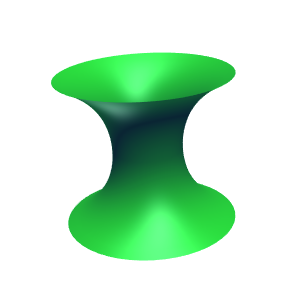
Discription: Hyperbolic shape created by rotating a plan curve described using a set of parametric equations around a rotation axis that lies on the same plan. Various shapes can be created by changing parameters.
Link: Click this link to see the live chart or shape.
Template: Graphics/3d-shape-of-revolution
Discription: Biquadrate parabola created by rotating a plan curve described using a set of parametric equations around a rotation axis that lies on the same plan.
Link: Click this link to see the live chart or shape.
Template: Graphics/3d-shape-of-revolution
Discription: Parabolic Humming-top created by rotating a plan curve described using a set of parametric equations around a rotation axis that lies on the same plan. Various shapes can be created by changing parameters.
Link: Click this link to see the live chart or shape.

Template: Graphics/3d-shape-of-revolution
Discription: Parabolic log created by rotating a plan curve described using a set of parametric equations around a rotation axis that lies on the same plan. Various shapes can be created by changing parameters.
Link: Click this link to see the live chart or shape.

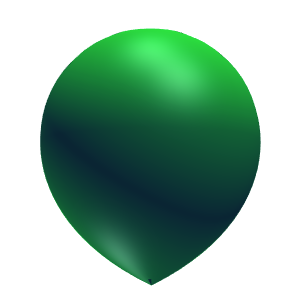
Template: Graphics/3d-shape-of-revolution
Discription: Pear created by rotating a plan curve described using a set of parametric equations around a rotation axis that lies on the same plan. Various shapes can be created by changing parameters.
Link: Click this link to see the live chart or shape.
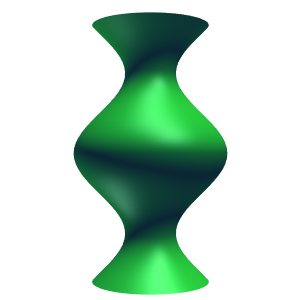
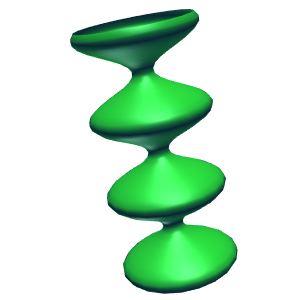
Template: Graphics/3d-shape-of-revolution
Discription: Sine square shape created by rotating a plan curve described using a set of parametric equations around a rotation axis that lies on the same plan. Various shapes can be created by changing parameters.
Link: Click this link to see the live chart or shape.
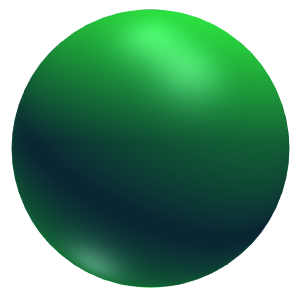
Template: Graphics/3d-shape-of-revolution
Discription: Sphere created by rotating a plan curve described using a set of parametric equations around a rotation axis that lies on the same plan. Various shapes can be created by changing parameters.
Link: Click this link to see the live chart or shape.
Template: Graphics/3d-shape-of-revolution
Discription: Torus created by rotating a plan curve described using a set of parametric equations around a rotation axis that lies on the same plan. Various shapes can be created by changing parameters.
Link: Click this link to see the live chart or shape.
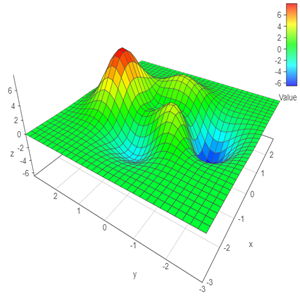
Template: Graphics/3d-simple-chart
Discription: This template creates a simple 3D chart for a mathematical peaks function with two variables or an x-y-z data set.
Link: Click this link to see the live chart or shape.
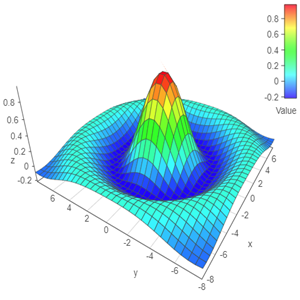
Template: Graphics/3d-simple-chart
Discription: This template creates a simple 3D chart for a mathematical sinc function with two variables or an x-y-z data set.
Link: Click this link to see the live chart or shape.
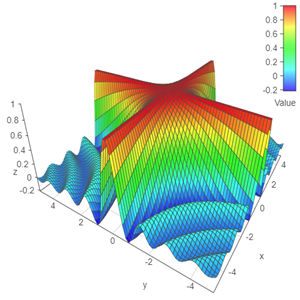
Template: Graphics/3d-simple-chart
Discription: This template creates a simple 3D chart for a mathematical sincXY function with two variables or an x-y-z data set.
Link: Click this link to see the live chart or shape.
Template: Graphics/3d-simple-chart
Discription: This template creates a simple 3D sine and exponential chart for a mathematical function with two variables or an x-y-z data set.
Link: Click this link to see the live chart or shape.
Template: Graphics/complex-3d-chart
Discription: 3D chart for magnitude, real part, imaginary part, or phase of a specified complex-variable function over a complex plan.
Link: Click this link to see the live chart or shape.
Template: Graphics/3d-parametric-shape
Discription: This template creates a simple 3D shape for a mathematical sinc function with two variables u and v.
Link: Click this link to see the live chart or shape.
Template: Graphics/3d-parametric-shape
Discription: This template creates a simple 3D shape for a mathematical sincXY function with two parametric variables u and v.
Link: Click this link to see the live chart or shape.
Template: Graphics/complex-3d-chart
Discription: 3D chart for magnitude, real part, imaginary part, or phase of a specified complex-variable function over a complex plan.
Link: Click this link to see the live chart or shape.
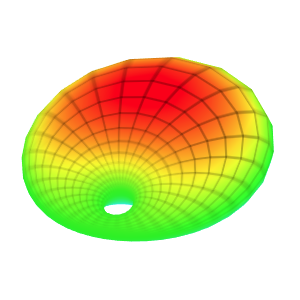
Template: Graphics/3d-parametric-shape
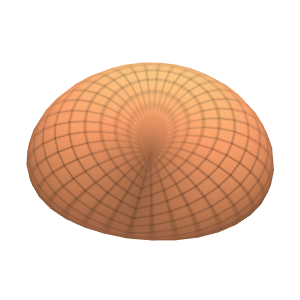
Discription: This template creates a parametric soucoupoid surface with a set of parametric equations.
Link: Click this link to see the live chart or shape.
Template: Graphics/3d-parametric-chart
Discription: This template creates a parametric soucoupoid surface with a set of parametric equations.
Link: Click this link to see the live chart or shape.
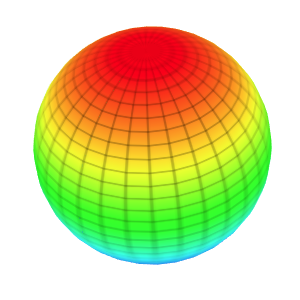
Template: Graphics/3d-parametric-shape
Discription: This template creates a parametric sphere surface with a set of parametric equations.
Link: Click this link to see the live chart or shape.

Template: Graphics/3d-parametric-chart
Discription: This template creates a parametric sphere surface with a set of parametric equations.
Link: Click this link to see the live chart or shape.
Template: Graphics/complex-3d-chart
Discription: 3D chart for magnitude, real part, imaginary part, or phase of a specified complex-variable function over a complex plan.
Link: Click this link to see the live chart or shape.
Template: Graphics/complex-3d-chart
Discription: 3D chart for magnitude, real part, imaginary part, or phase of a specified complex-variable function over a complex plan.
Link: Click this link to see the live chart or shape.
Template: Graphics/complex-3d-chart
Discription: 3D chart for magnitude, real part, imaginary part, or phase of a specified complex-variable function over a complex plan.
Link: Click this link to see the live chart or shape.
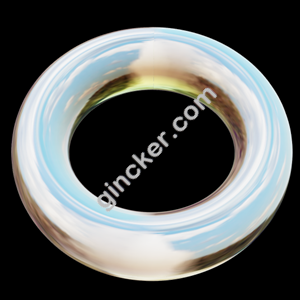
Template: Graphics/3d-parametric-shape
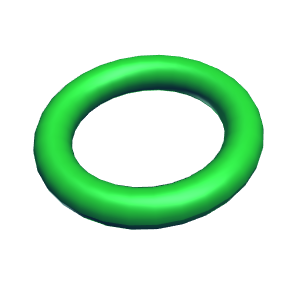
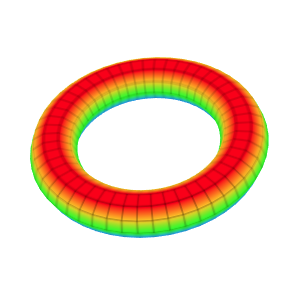
Discription: A torus is a surface of revolution generated by revolving a circle in 3D space about an axis coplanar with the circle. If the axis of revolution does not touch the circle, the surface has a ring shape and is called a torus.
Link: Click this link to see the live chart or shape.
Template: Graphics/3d-parametric-chart
Discription: A torus is a surface of revolution generated by revolving a circle in 3D space about an axis coplanar with the circle. If the axis of revolution does not touch the circle, the surface has a ring shape and is called a torus.
Link: Click this link to see the live chart or shape.
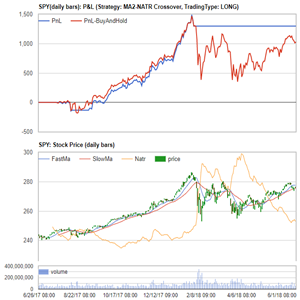
Template: Finance/stock-backtest-crossover
Discription: The template uses MA2-NATR crossover strategy that combines the MA2 crossover with the average true range indicator. The MA crossover indicates the strength and direction of the market trend, while true-range indicator is used to identify whether the market is in the trending region or not.
Link: Click this link to see the live chart or shape.
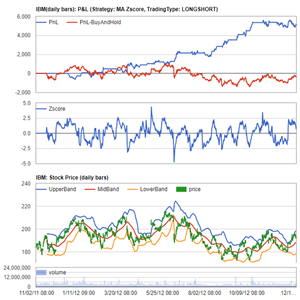
Template: Financestock-backtest-zscore
Discription: This template allows you to backtest the MA-Zscore strategy. This strategy uses the Bollinger band-like model based on the moving average.
Link: Click this link to see the live chart or shape.
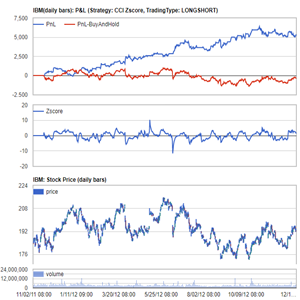
Template: Finance/stock-backtest-zscore
Discription: This strategy is based on CCI indicator. CCI measures the current price level relative to an average price level over a given period of time. It can be used to identify overbought and oversold levels. .
Link: Click this link to see the live chart or shape.
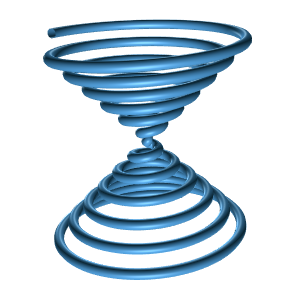
Template: Graphics/3d-tube-shape
Discription: This template creates a 3D cone tube that extrudes along a 3D curve based on a set of parametric equations x(t), y(t), and z(t).
Link: Click this link to see the live chart or shape.
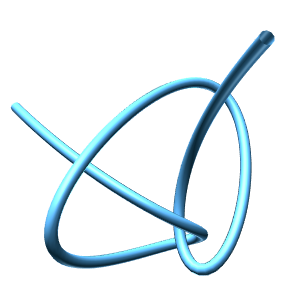
Template: Graphics/3d-tube-shape
Discription: This template creates a 3D figure eight knot tube that extrudes along a 3D curve based on a set of parametric equations x(t), y(t), and z(t).
Link: Click this link to see the live chart or shape.

Template: Graphics/3d-tube-shape
Discription: This template creates another figure eight knot tube that extrudes along a 3D curve based on a set of parametric equations x(t), y(t), and z(t).
Link: Click this link to see the live chart or shape.

Template: Graphics/3d-tube-shape
Discription: This template creates yet another figure eight knot tube that extrudes along a 3D curve based on a set of parametric equations x(t), y(t), and z(t).
Link: Click this link to see the live chart or shape.
Template: Graphics/3d-tube-shape
Discription: This template creates a heart tube that extrudes along a 3D curve based on a set of parametric equations x(t), y(t), and z(t).
Link: Click this link to see the live chart or shape.

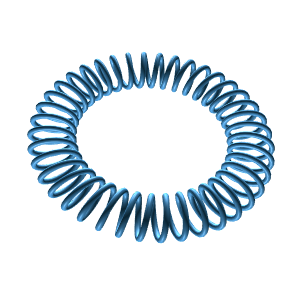
Template: Graphics/3d-tube-shape
Discription: This template creates a helix tube that extrudes along a 3D curve based on a set of parametric equations x(t), y(t), and z(t).
Link: Click this link to see the live chart or shape.
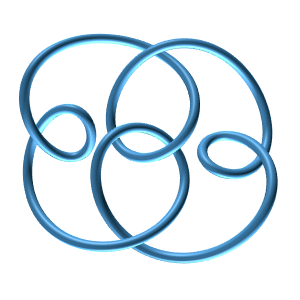
Template: Graphics/3d-tube-shape
Discription: This template creates a polynomial (3,1) knot tube that extrudes along a 3D curve based on a set of parametric equations x(t), y(t), and z(t).
Link: Click this link to see the live chart or shape.

Template: Graphics/3d-tube-shape
Discription: This template creates a polynomial (4,1) knot tube that extrudes along a 3D curve based on a set of parametric equations x(t), y(t), and z(t).
Link: Click this link to see the live chart or shape.
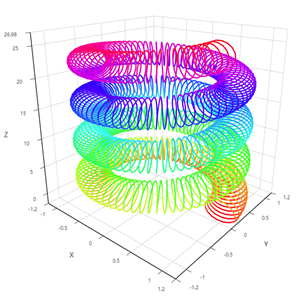
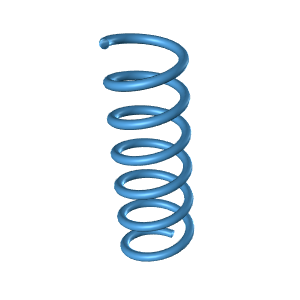
Template: Graphics/3d-tube-shape
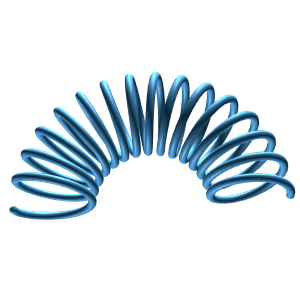
Discription: This template creates a slinky tube that extrudes along a 3D curve based on a set of parametric equations x(t), y(t), and z(t).
Link: Click this link to see the live chart or shape.
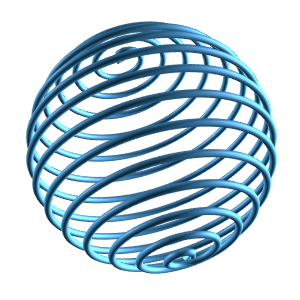
Template: Graphics/3d-tube-shape
Discription: This template creates a sphere tube that extrudes along a 3D curve based on a set of parametric equations x(t), y(t), and z(t).
Link: Click this link to see the live chart or shape.
Template: Graphics/3d-tube-shape
Discription: This template creates a torus tube that extrudes along a 3D curve based on a set of parametric equations x(t), y(t), and z(t).
Link: Click this link to see the live chart or shape.
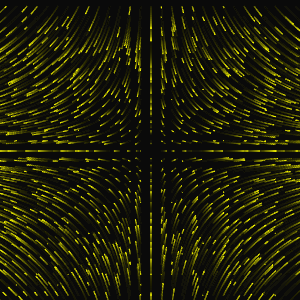
Template: Graphics/vector-chart-from-field
Discription: Vector chart created using the field components for a wire current (magnetic field distribution).
Link: Click this link to see the live chart or shape.
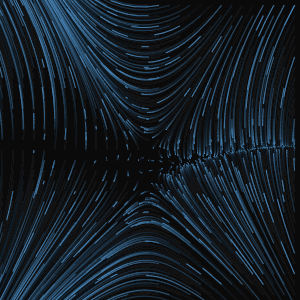
Template: Graphics/vector-chart-from-field
Discription: Vector chart created using the field components for a cosine-sine field.
Link: Click this link to see the live chart or shape.
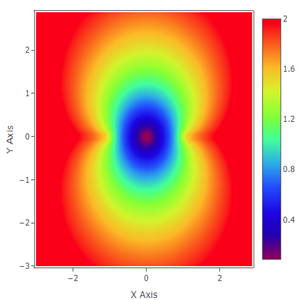
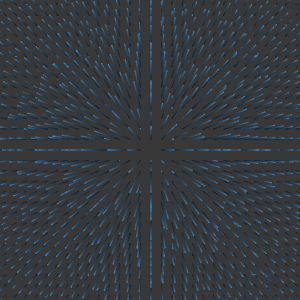
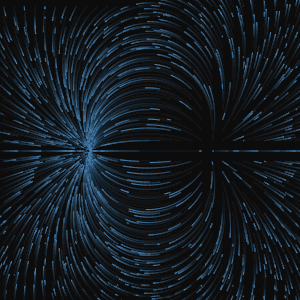
Template: Graphics/vector-chart-from-field
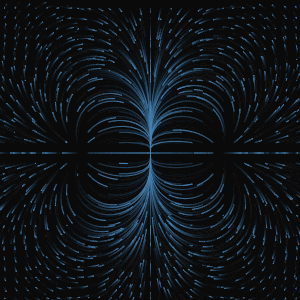
Discription: Vector chart created using the field components for an electric dipole field.
Link: Click this link to see the live chart or shape.
Template: Graphics/vector-chart-from-field
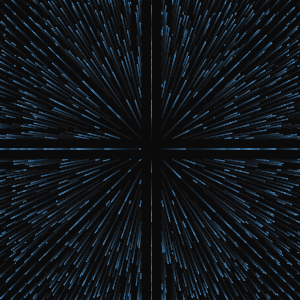
Discription: Vector chart created using the field components for a point charge.
Link: Click this link to see the live chart or shape.
Template: Graphics/vector-chart-from-field
Discription: Vector chart created using the field components for a wind model.
Link: Click this link to see the live chart or shape.
Template: Graphics/vector-chart-from-field
Discription: Vector chart created using the field components for an X-Y field.
Link: Click this link to see the live chart or shape.
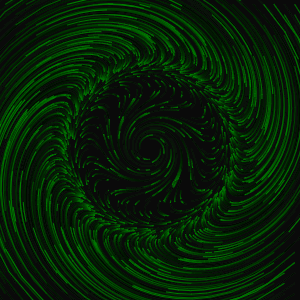
Template: Graphics/vector-chart-from-potential
Discription: Vector chart created using potential for a potential function of a*y*sin(x) + b*x*y^2.
Link: Click this link to see the live chart or shape.
Template: Graphics/vector-chart-from-potential
Discription: Vector chart created from potential for a charge rod.
Link: Click this link to see the live chart or shape.

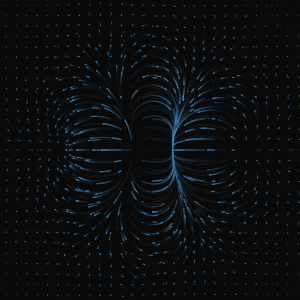
Template: Graphics/vector-chart-from-potential
Discription: Vector chart created using potential for an electric dipole.
Link: Click this link to see the live chart or shape.
Template: Graphics/vector-chart-from-potential
Discription: Vector chart created using the potential for an electric octupole.
Link: Click this link to see the live chart or shape.
Template: Graphics/vector-chart-from-potential
Discription: Vector chart created using potential for a point charge.
Link: Click this link to see the live chart or shape.
Template: Graphics/vector-chart-from-potential
Discription: Vector chart created using the potential for an electric quadrupole.
Link: Click this link to see the live chart or shape.
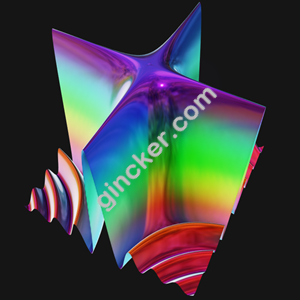
Template: Graphics/3d-parametric-chart
Discription: A Whitney umbrella is a self-intersecting surface placed in 3D space. It is the union of all straight lines that pass through points of a fixed parabola and are perpendicular to a fixed straight line, parallel to the axis of the parabola and lying on its perpendicular bisecting plane.
Link: Click this link to see the live chart or shape.
Template: Graphics/complex-3d-chart
Discription: 3D chart for magnitude, real part, imaginary part, or phase of a specified complex-variable function over a complex plan.
Link: Click this link to see the live chart or shape.